Next: Declination Axis
Up: The Cloud Camera
Previous: The Cloud Camera
Contents
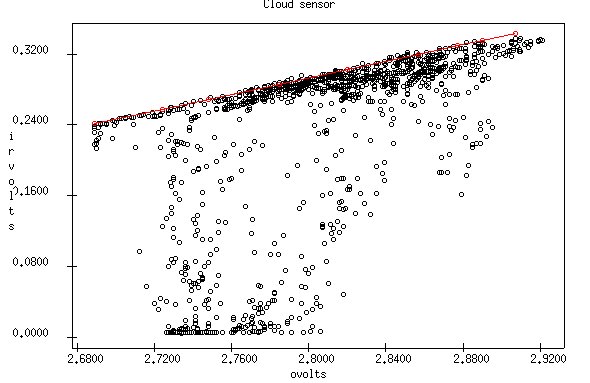
The infrared sensor puts out a voltage depending on the difference between the case temperature and the sky temperature. The sensor voltage is denoted irvolts and the case temperature is related to ovolts. I determine the "cloud" calibration by observing the range of irvolts and ovolts over as wide a range of conditions as possible. Figure 3.10 is a graph of voltages measured over December 2006.
Figure 3.10:
Cloud Sensor Calibration
|
|
The upper envelope is the clearest sky. The bottom represents cloud. The amplifier can only produce positive signals and there unfortunately seems to be a negative bias, which I will remove by installing a resistor in the future. However we can still continue. By assuming the "clear" value is the red in the graph and "cloudy" is 0 irvolts. We come up with the crazy formula that:
cloud=1 - (irvolts - (ovolts-2.820)*0.467)/0.3
where cloud ranges from  . The formula does a good job for clear skies and lousy for really cloudy ones. In other words if cloud
  don't bother.
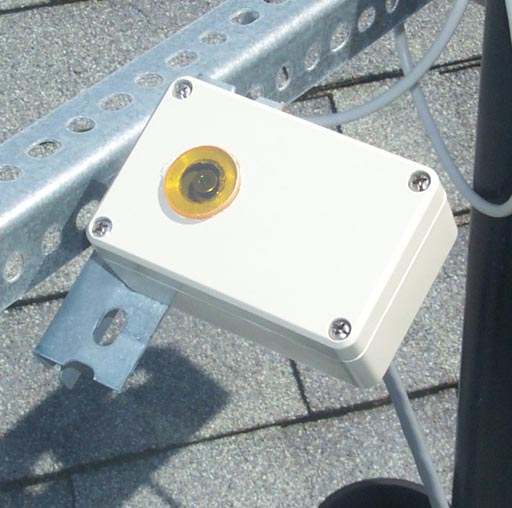
Figure 3.11 is a photo of the cloud sensor mounted on the roof.
Figure 3.11:
Photo of Cloud Sensor
|
|
Next: Declination Axis
Up: The Cloud Camera
Previous: The Cloud Camera
Contents
Louis-Gregory Strolger
2012-01-09