Next: Tilt Assembly
Up: Temperature Sensors
Previous: Communications
Contents
Here is a
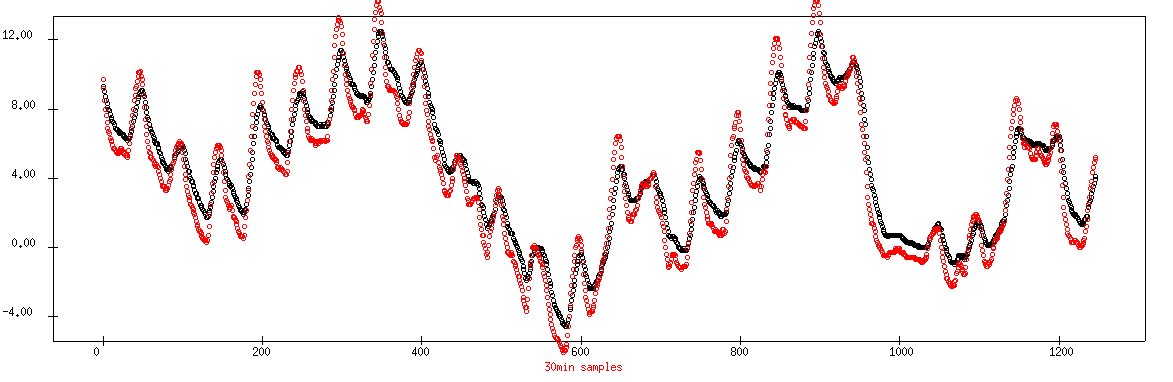
Figure 3.31:
Graph of about one month of data in December 2006 plotting black TempSensor A:black and TempSensor F:red. Note the quicker response of the secondary mirror sensor.
|
|
Table 3.24:
Chart of the average temperature and standard deviations of the sensors as well as the METS OAT sensor over 1 month.
| Sensor |
Mean |
Std.Dev |
| A |
4.41 |
3.7 |
| C |
4.87 |
3.7 |
| E |
4.15 |
4.1 |
| F |
3.96 |
4.2 |
| H |
6.96 |
4.1 |
| oat |
5.15 |
5.6 |
Note the lower standard deviations of A and C rather than the ones closer to air temperature such as F or OAT. There is a few a lag of a few hours. Also the H sensor seems to be anomalously high.
The B, D and G sensors seem to be DOA.
1/3/2007: The D temperature sensor seems to have died.
Conclusion: recommend using the A sensor for determining the focus position. In fact it might be desirable to integrate the A reading and damp it a bit, but this is probably not necessary.
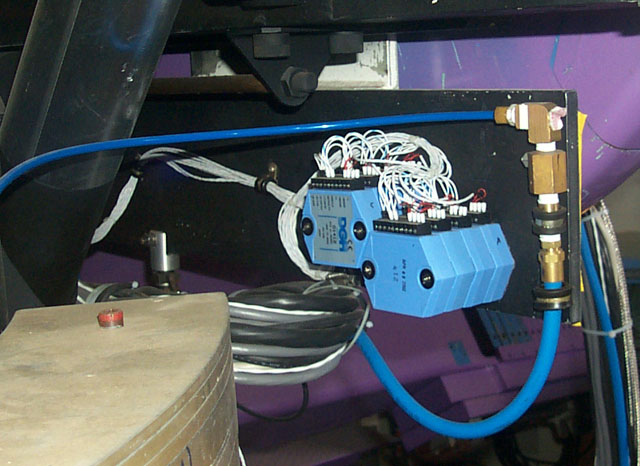
Figure 3.32:
Photo of all the hockey pucks on the East side of the telescope.
|
|
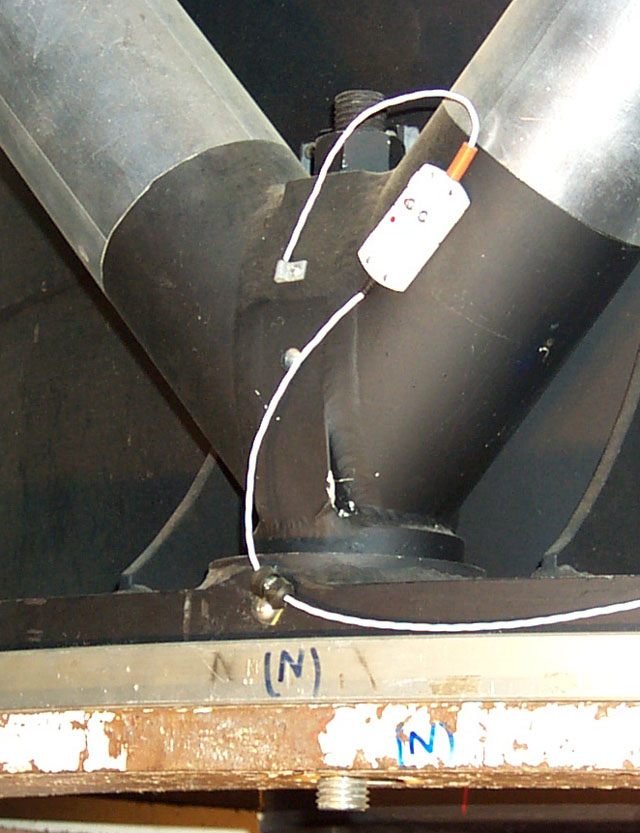
Figure 3.33:
Photo of Temperature Sensor A on the lower truss at the North.
|
|
Next: Tilt Assembly
Up: Temperature Sensors
Previous: Communications
Contents
Louis-Gregory Strolger
2012-01-09